
Thesis
I defended my thesis in July, 2018, the primary focus of which is the polarization calibration of the Atacama Cosmology Telesecope. You can find a pdf copy of it here. I include the abstract below in case you don’t want to commit to the 74 MB download.
Abstract
We are currently in an era of precision cosmology. Study of the Cosmic Microwave Background (CMB) has been central to our understanding of the universe ever since its discovery in 1965. Recent results from the Planck satellite have provided the best constraints on the 6-parameter model, the “standard model” of cosmology. In order to improve these constraints we must further the development of the technologies used to measure the CMB as well as our understanding of their associated systematics.
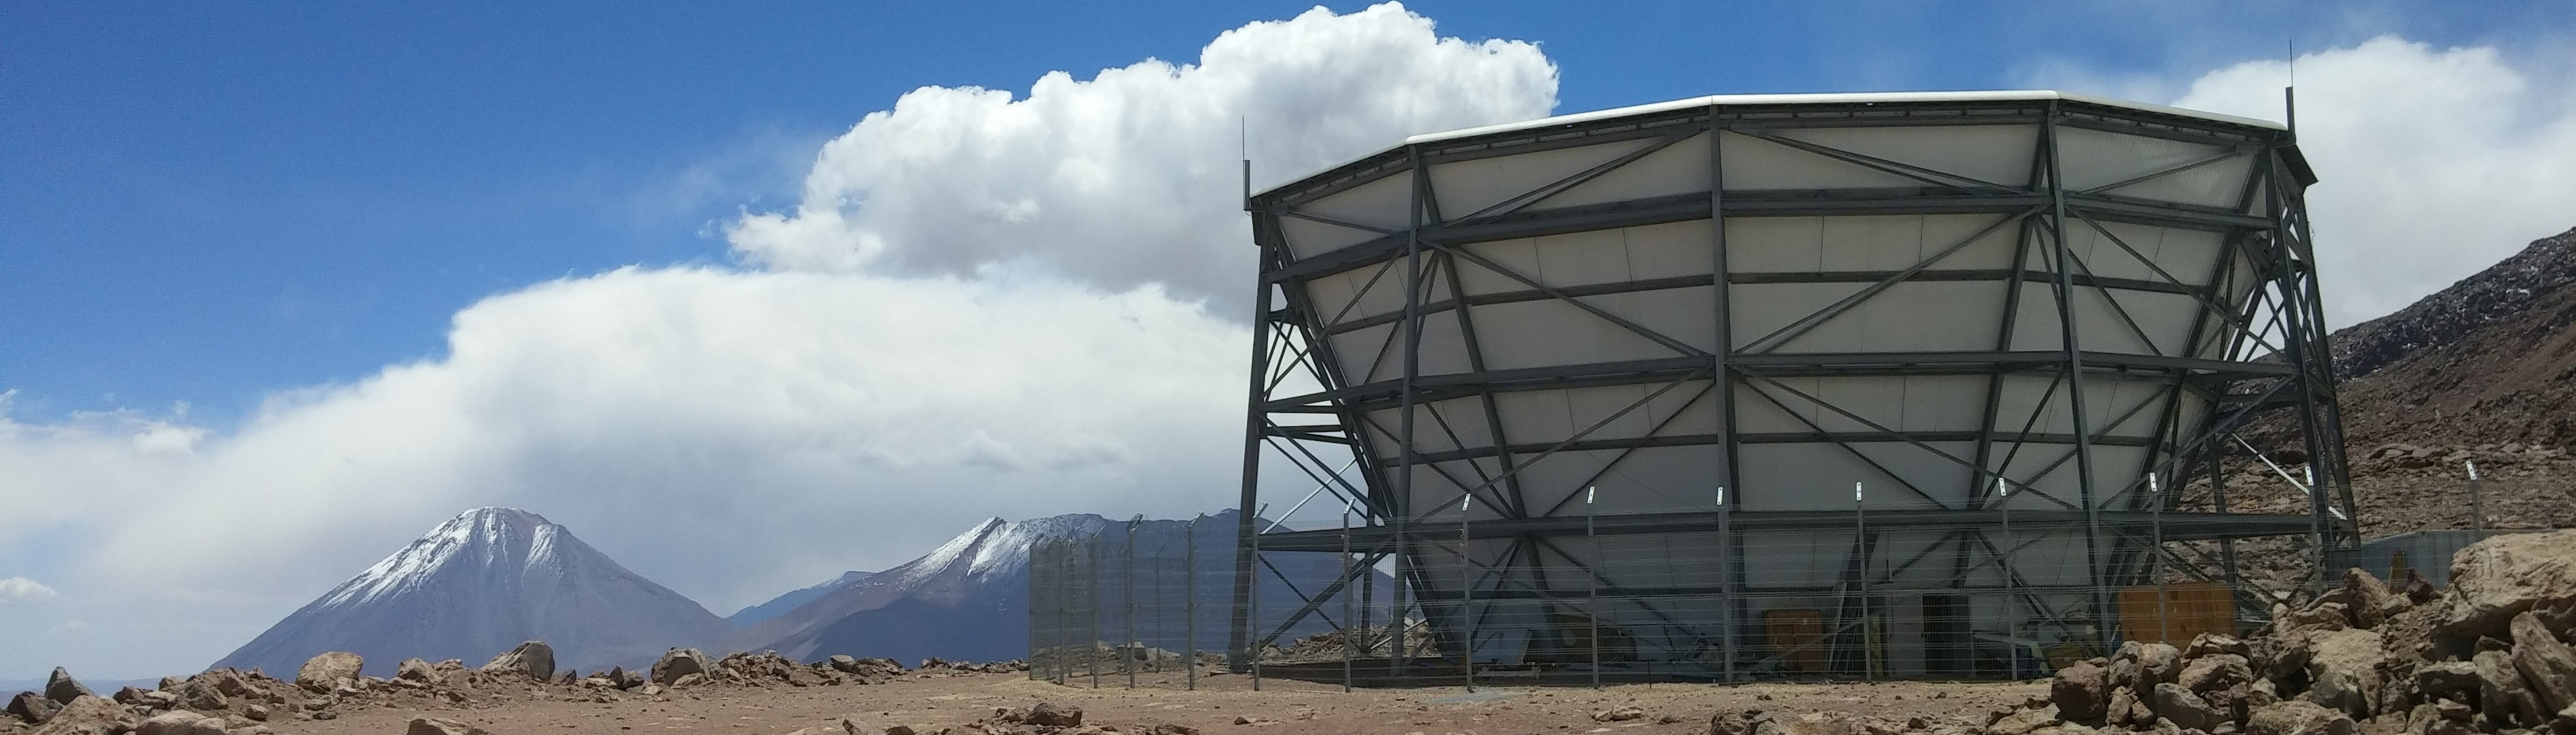
The Atacama Cosmology Telescope Polarimeter (ACTPol) and its successor instrument, known as Advanced ACTPol (AdvACT), are polarization sensitive upgrades to the Atacama Cosmology Telescope (ACT). ACT is an off-axis Gregorian telescope with a 6m primary reflector and a 2m secondary reflector. The ACTPol and AdvACT instruments utilize kilo-pixel scale arrays of superconducting transition edge sensor (TES) bolometers to measure the CMB anisotropies at frequencies ranging from 27-220 GHz. The increased spectral coverage of AdvACT will enable a wide range of CMB science, such as improving constraints on dark energy, the sum of the neutrino masses, and the existence of primordial gravitational waves. Precise polarization calibration can also enable improved constraints on cosmic polarization rotation.
In this thesis we present an overview of the AdvACT instrument before detailing the development of the AdvACT TES device geometries, which are tuned specifically for each of AdvACT’s five frequency bands (27, 39, 90, 150, and 220 GHz). Each detector couples to a single linear polarization. The angle of this coupling projected onto the sky is a critical calibration step in making maps of the CMB polarization. Any offset in this calibration angle can introduce a spurious B-mode polarization signal, resulting in non-zero EB and TB cross-correlation power spectra.
ACTPol uses a unique optical modeling based approach to this calibration. We present this procedure, as well as a method for directly measuring the relative angles of the detectors by use of a rapidly rotating polarizer. We also present maps of the polarized source Tau A, from the first three seasons of ACTPol at 90 and 150 GHz and discuss how these maps are affected by the polarization calibration. Finally, we discuss the telescope control, computer systems, and remote observations team which keep the telescope running, and briefly conclude with a summary that motivates improving calibration techniques for future CMB experiments.
Select Figures
Here are some select figures from each chapter with their captions.
Chapter 1
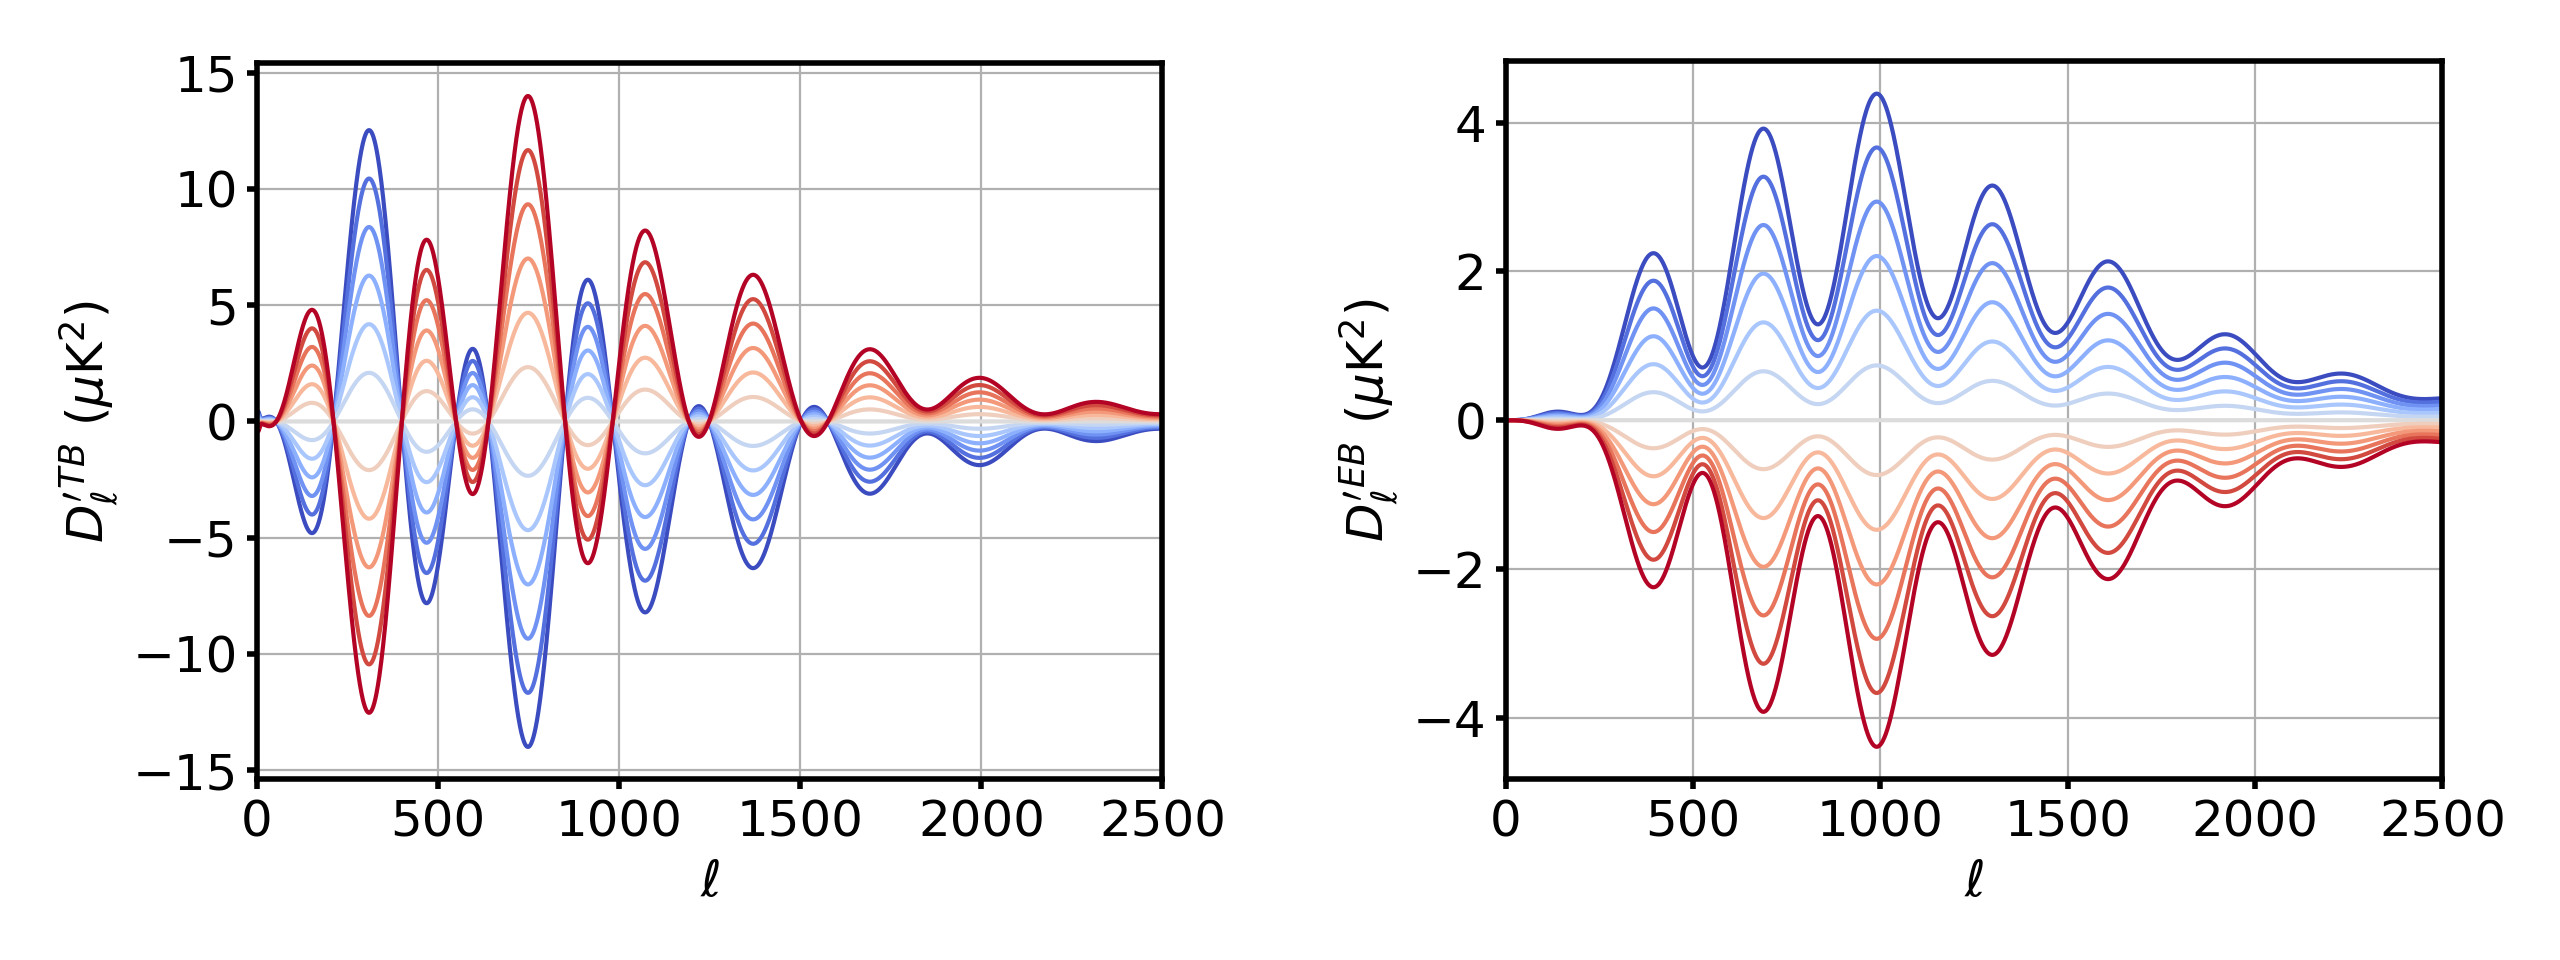
Demonstration of the effect of polarization rotation on the best fit CDM model power spectra from the Planck 2015 results [1]. A polarization rotation is applied, ranging from to , blue to red, in increments of .
Chapter 2
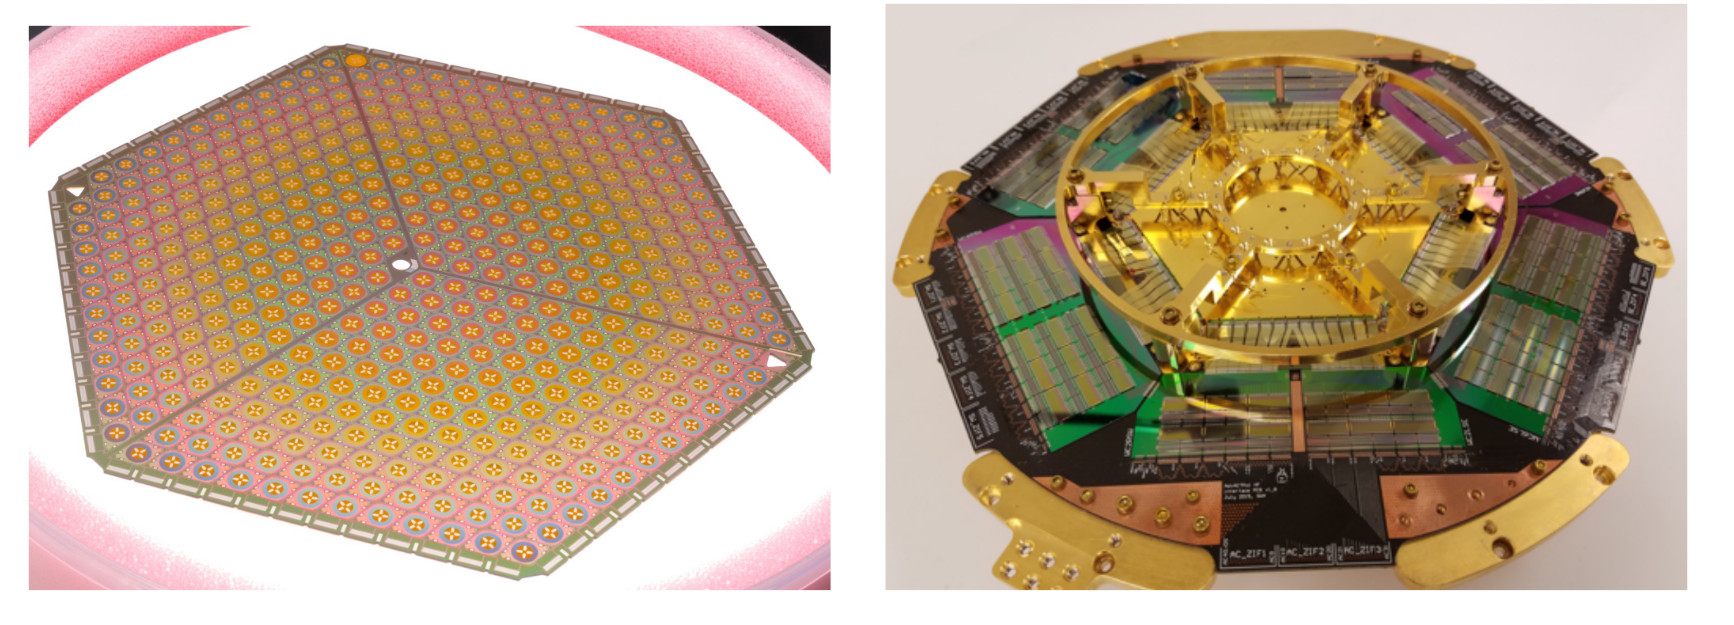
(Left): An AdvACT MF array detector wafer. Photo courtesy of the NIST Quantum Sensors group. (Right): The assembled AdvACT HF array as viewed from the backside
Chapter 3
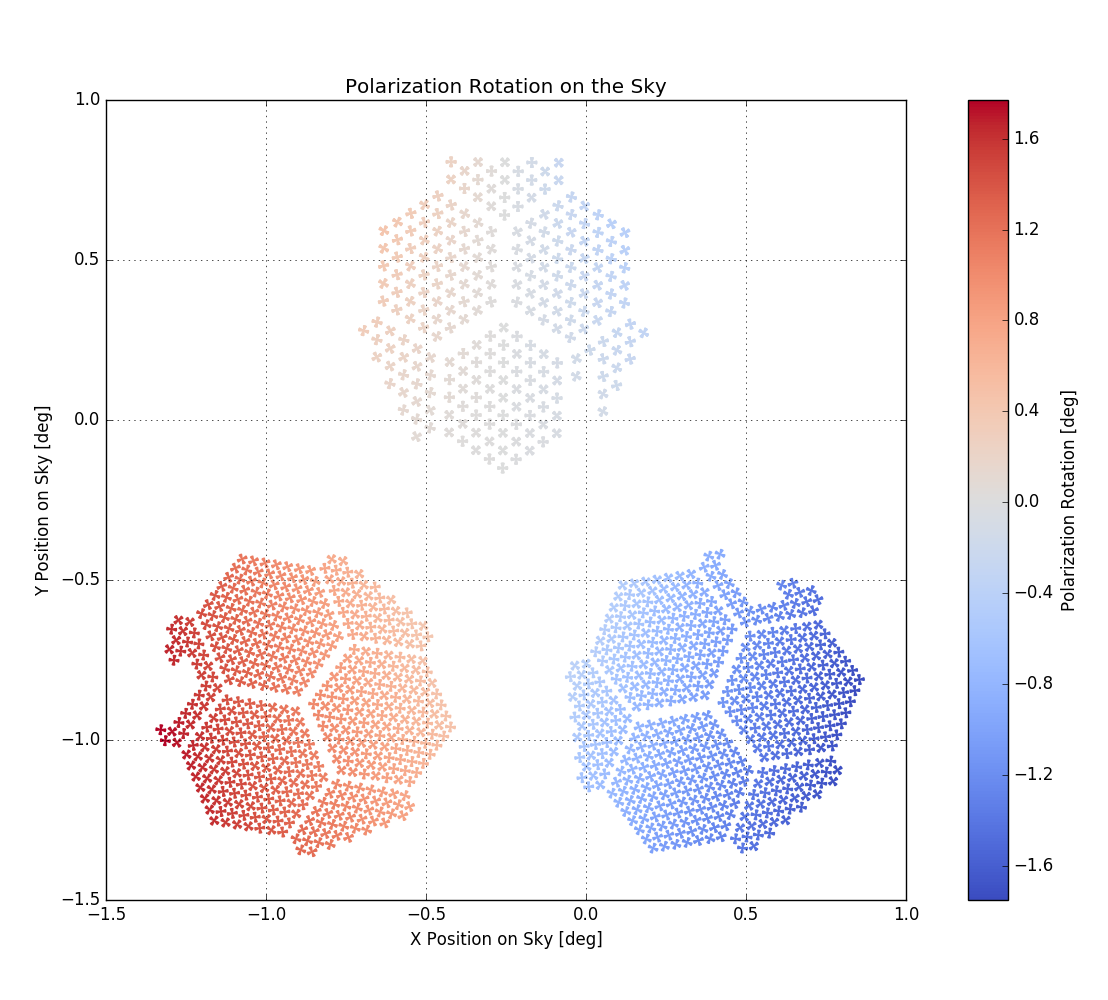
Plot of all three ACTPol arrays in sky coordinates. The angles of the plotted points correspond to the physical angle of the detectors in the telescope. The color scale corresponds to the additional polarization rotation caused by the ACTPol optics that is required to complete the angle calibration. This additional -1.7 to 1.7 degree rotation has been an important input to the detector angle calibration in published ACTPol results.
Chapter 4
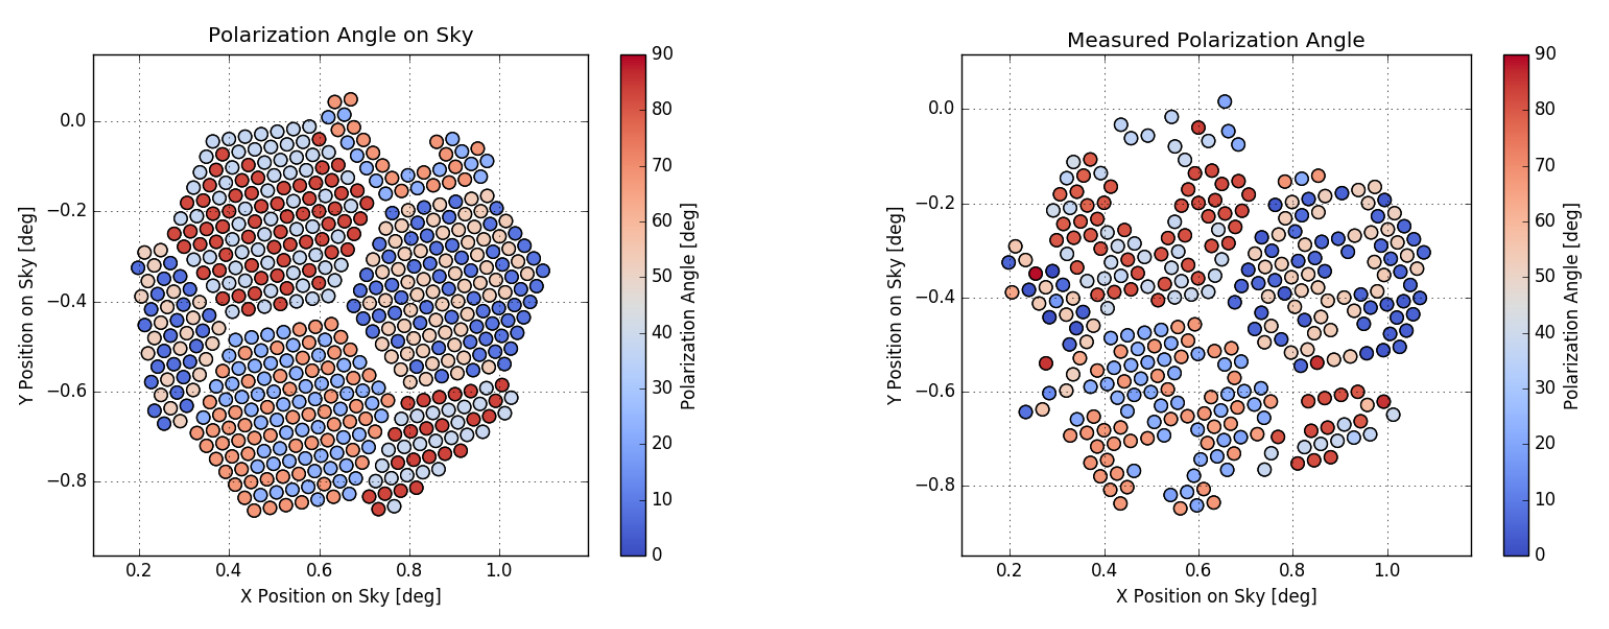
(Left): Physical detector angles for each detector pair projected on the sky. The color bar describes the angles of one of the detectors in each feedhorn, the other detector being orthogonal to the one plotted. (Right): Measured polarization angles from the polarization grid data sets. Like in the left panel, each circle represents a feedhorn which contains a pair of detectors orthogonal to one another. The color bar describes the angle of a single detector in the feed. Feeds are missing here, causing gaps when compared to the left panel, if they are missing a single detector in the pair due to less than 100\% yield in the array.
Chapter 5
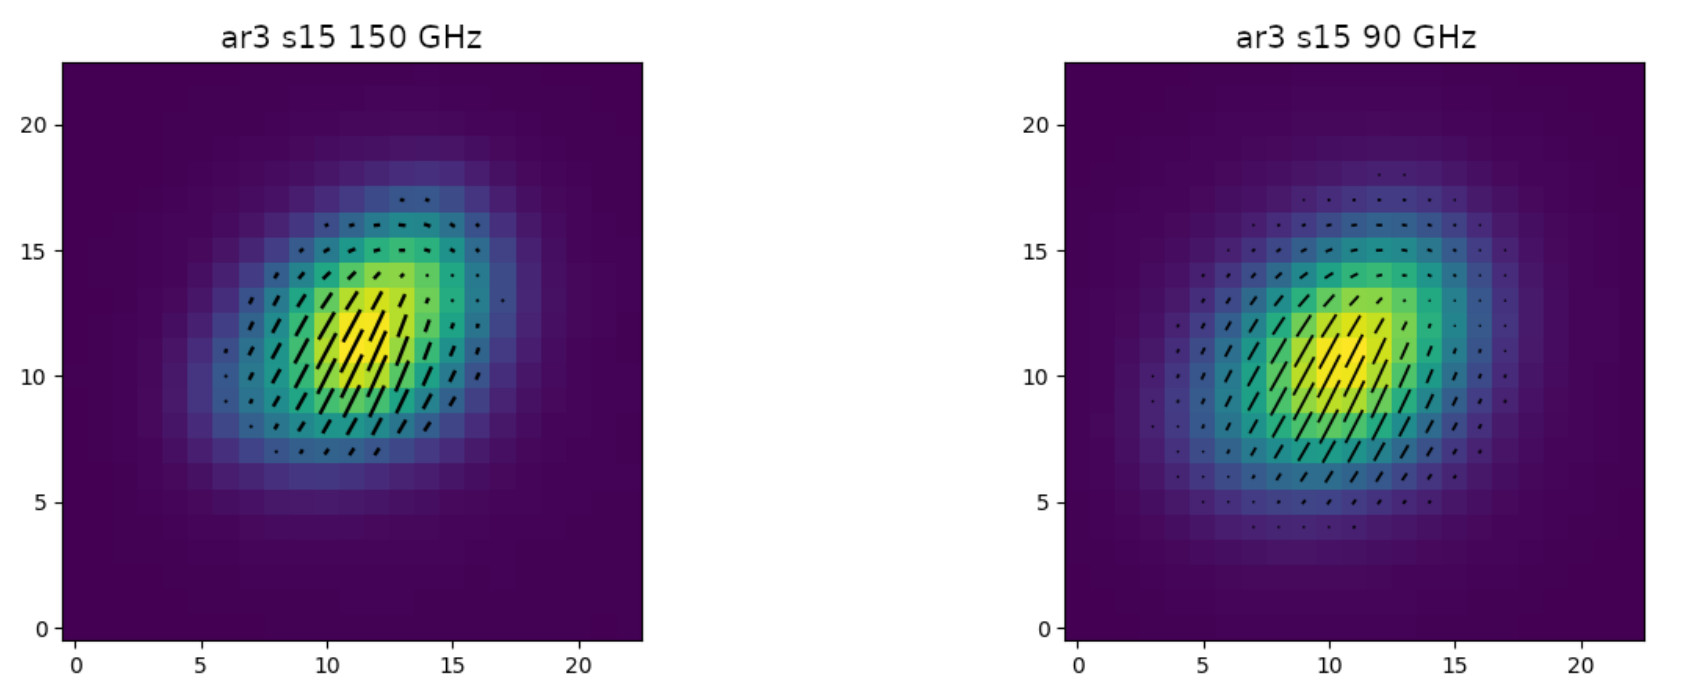
Intensity maps of Tau A with overplotted polarization angles from ar3 s15 at 150 and 90 GHz, respectively. Each map is made from a full stack of all the observations from the given array/season and shows the polarization angle for points above a low threshold in intensity, with length of the polarization angle lines being proportional to the linear polarization intensity, . Position units are in half arcminute pixels.